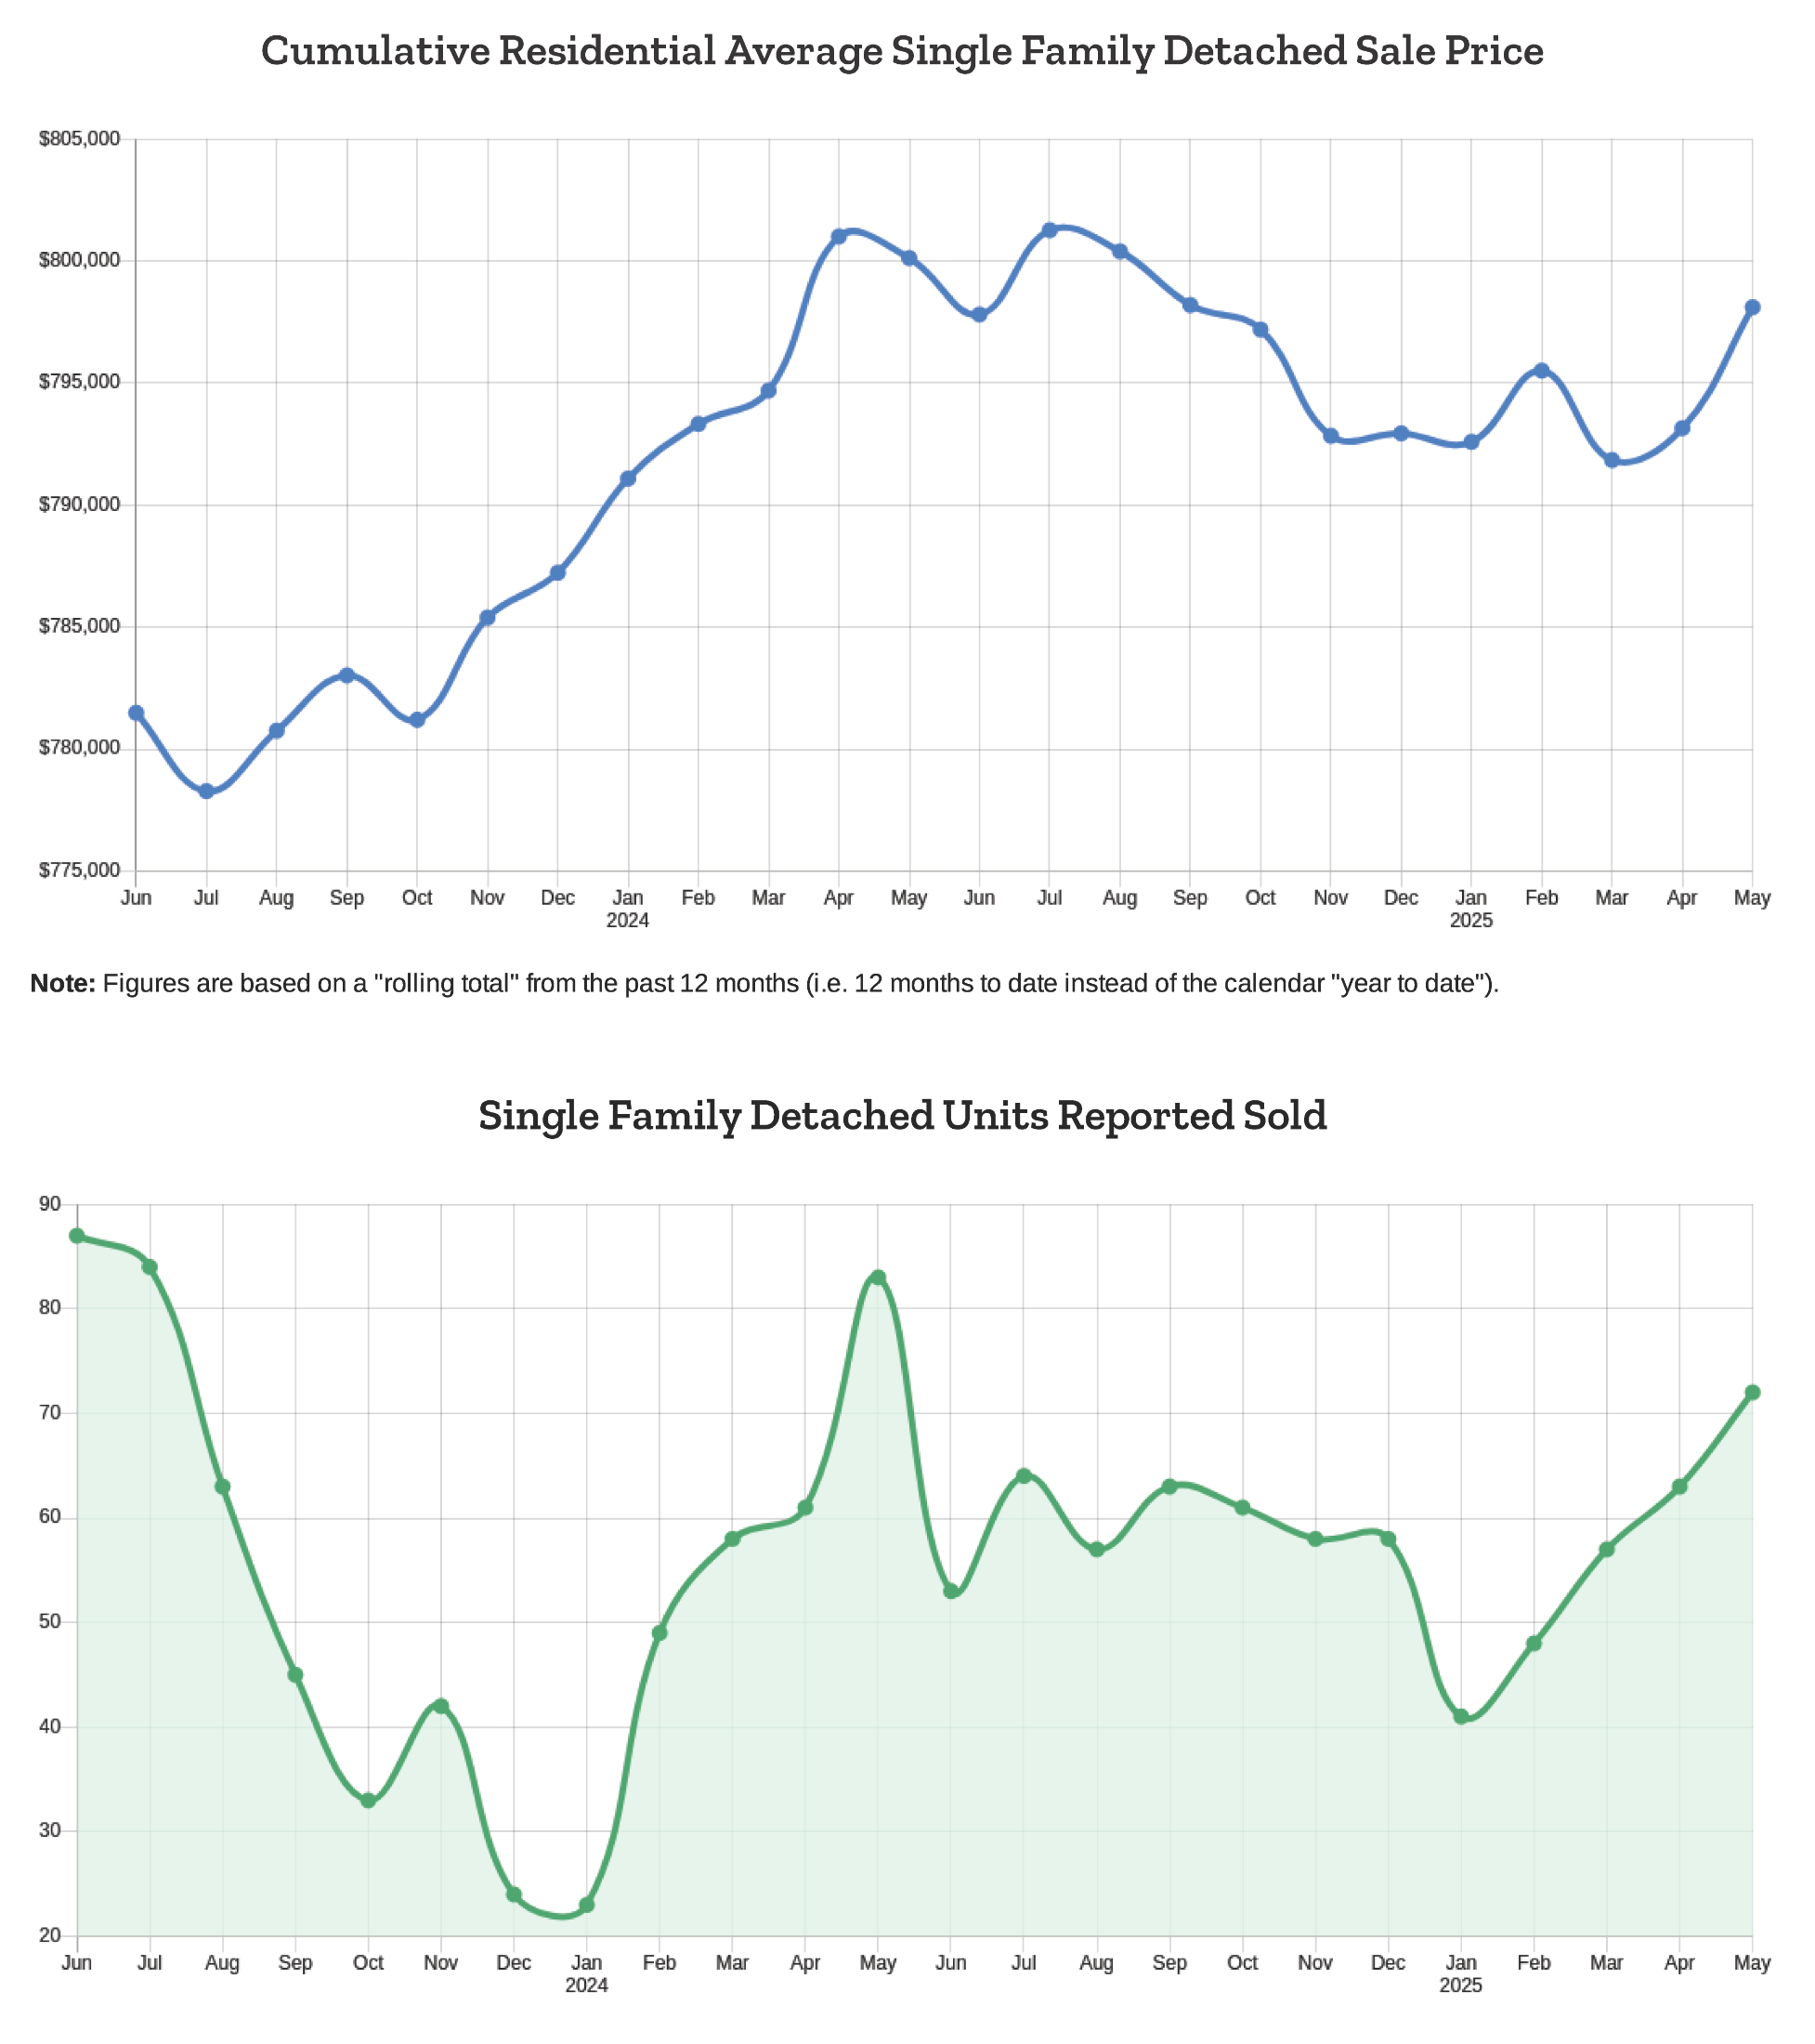
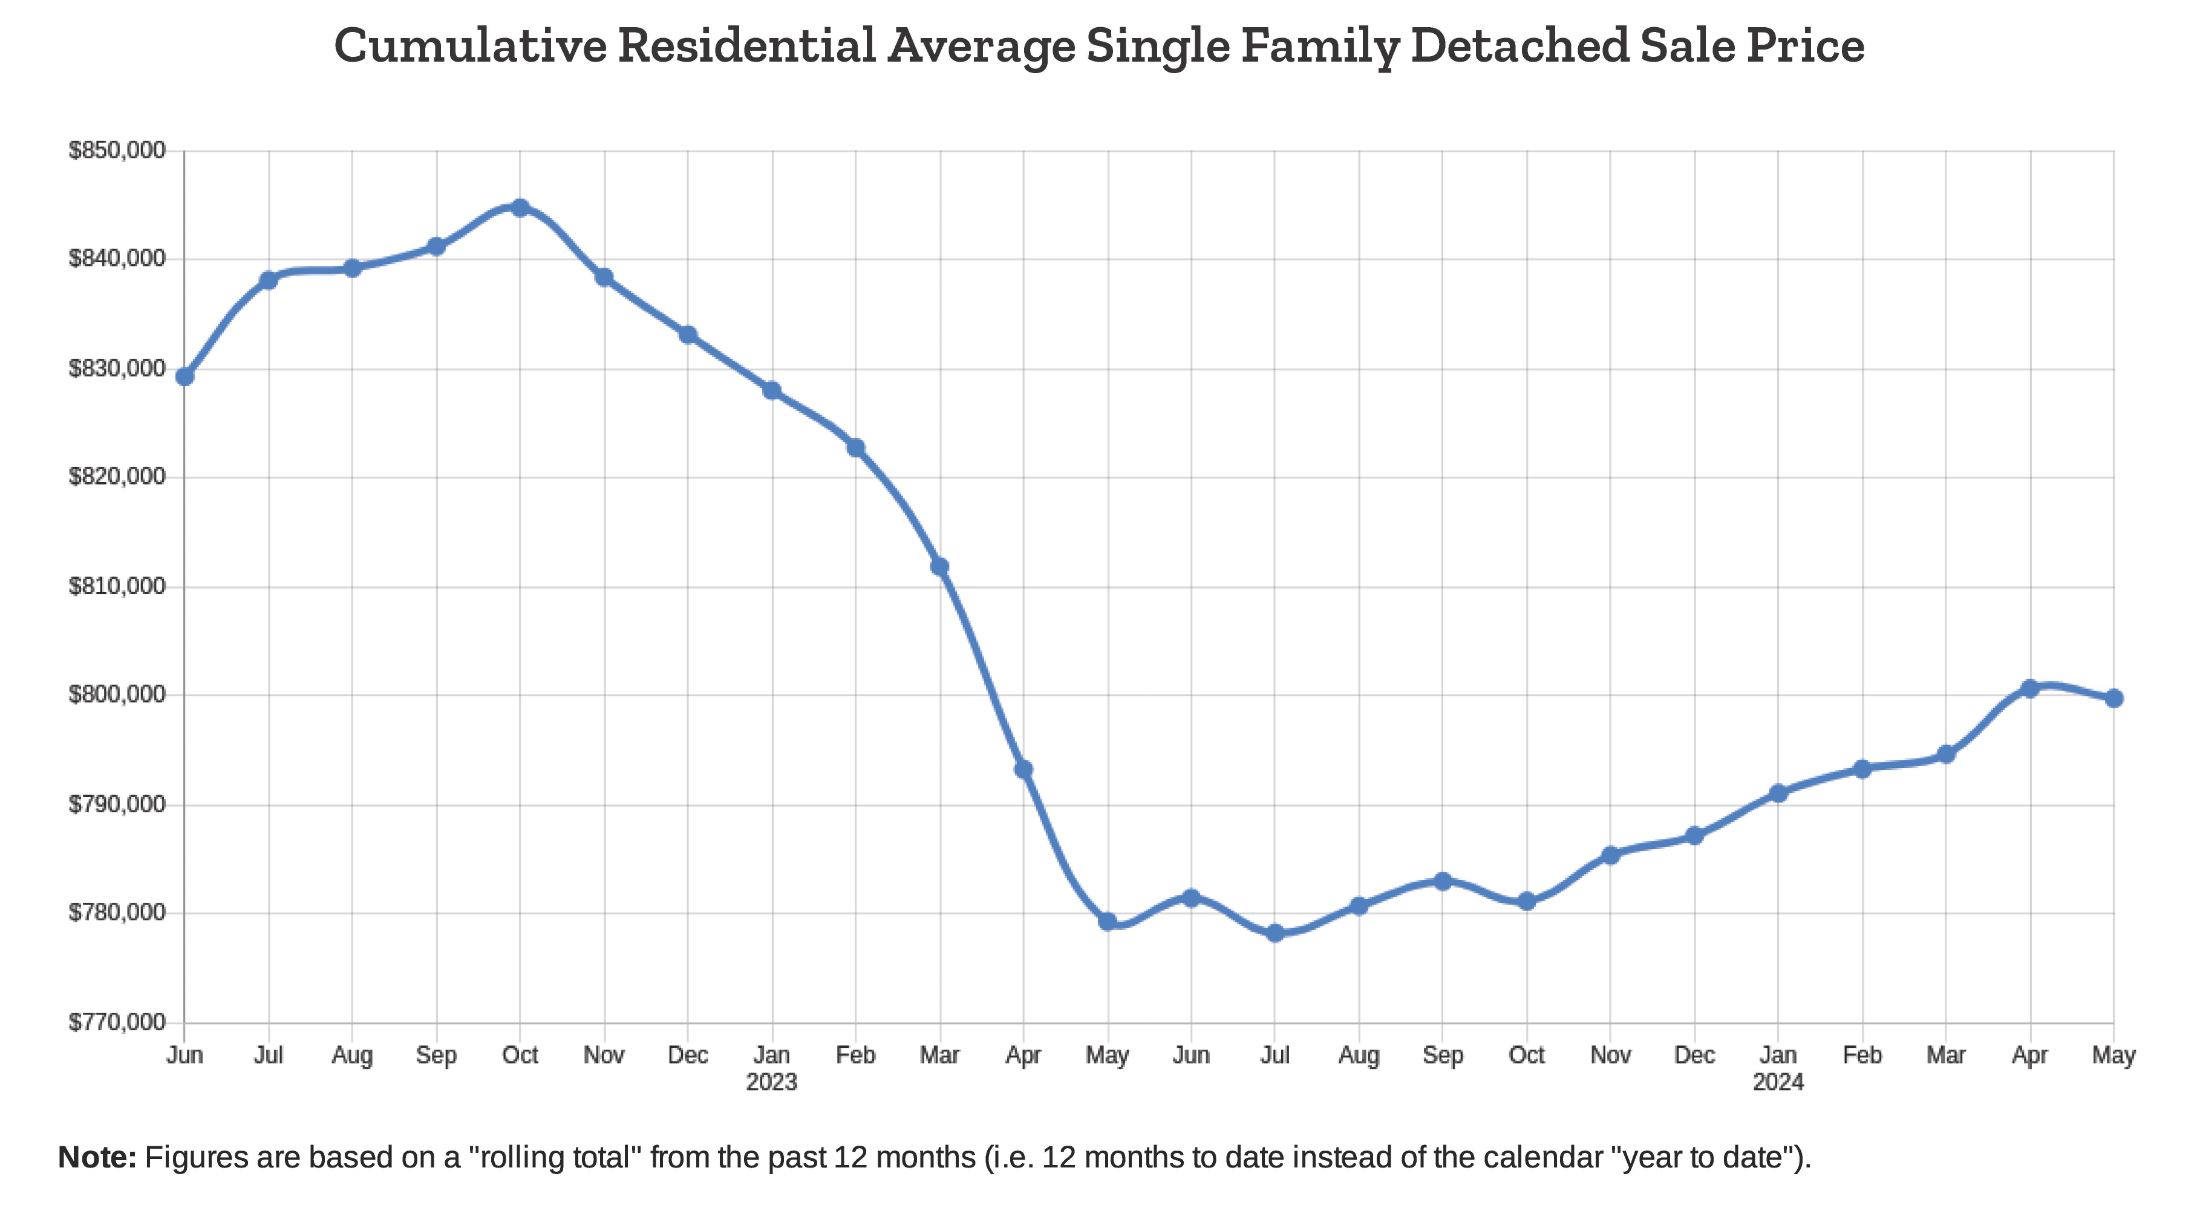
The average sale price for single-family homes in the Cowichan Valley saw a slight decrease:
June - $840,363
May - $847,883
April - $845,292
March - $781,617
Market Dynamics
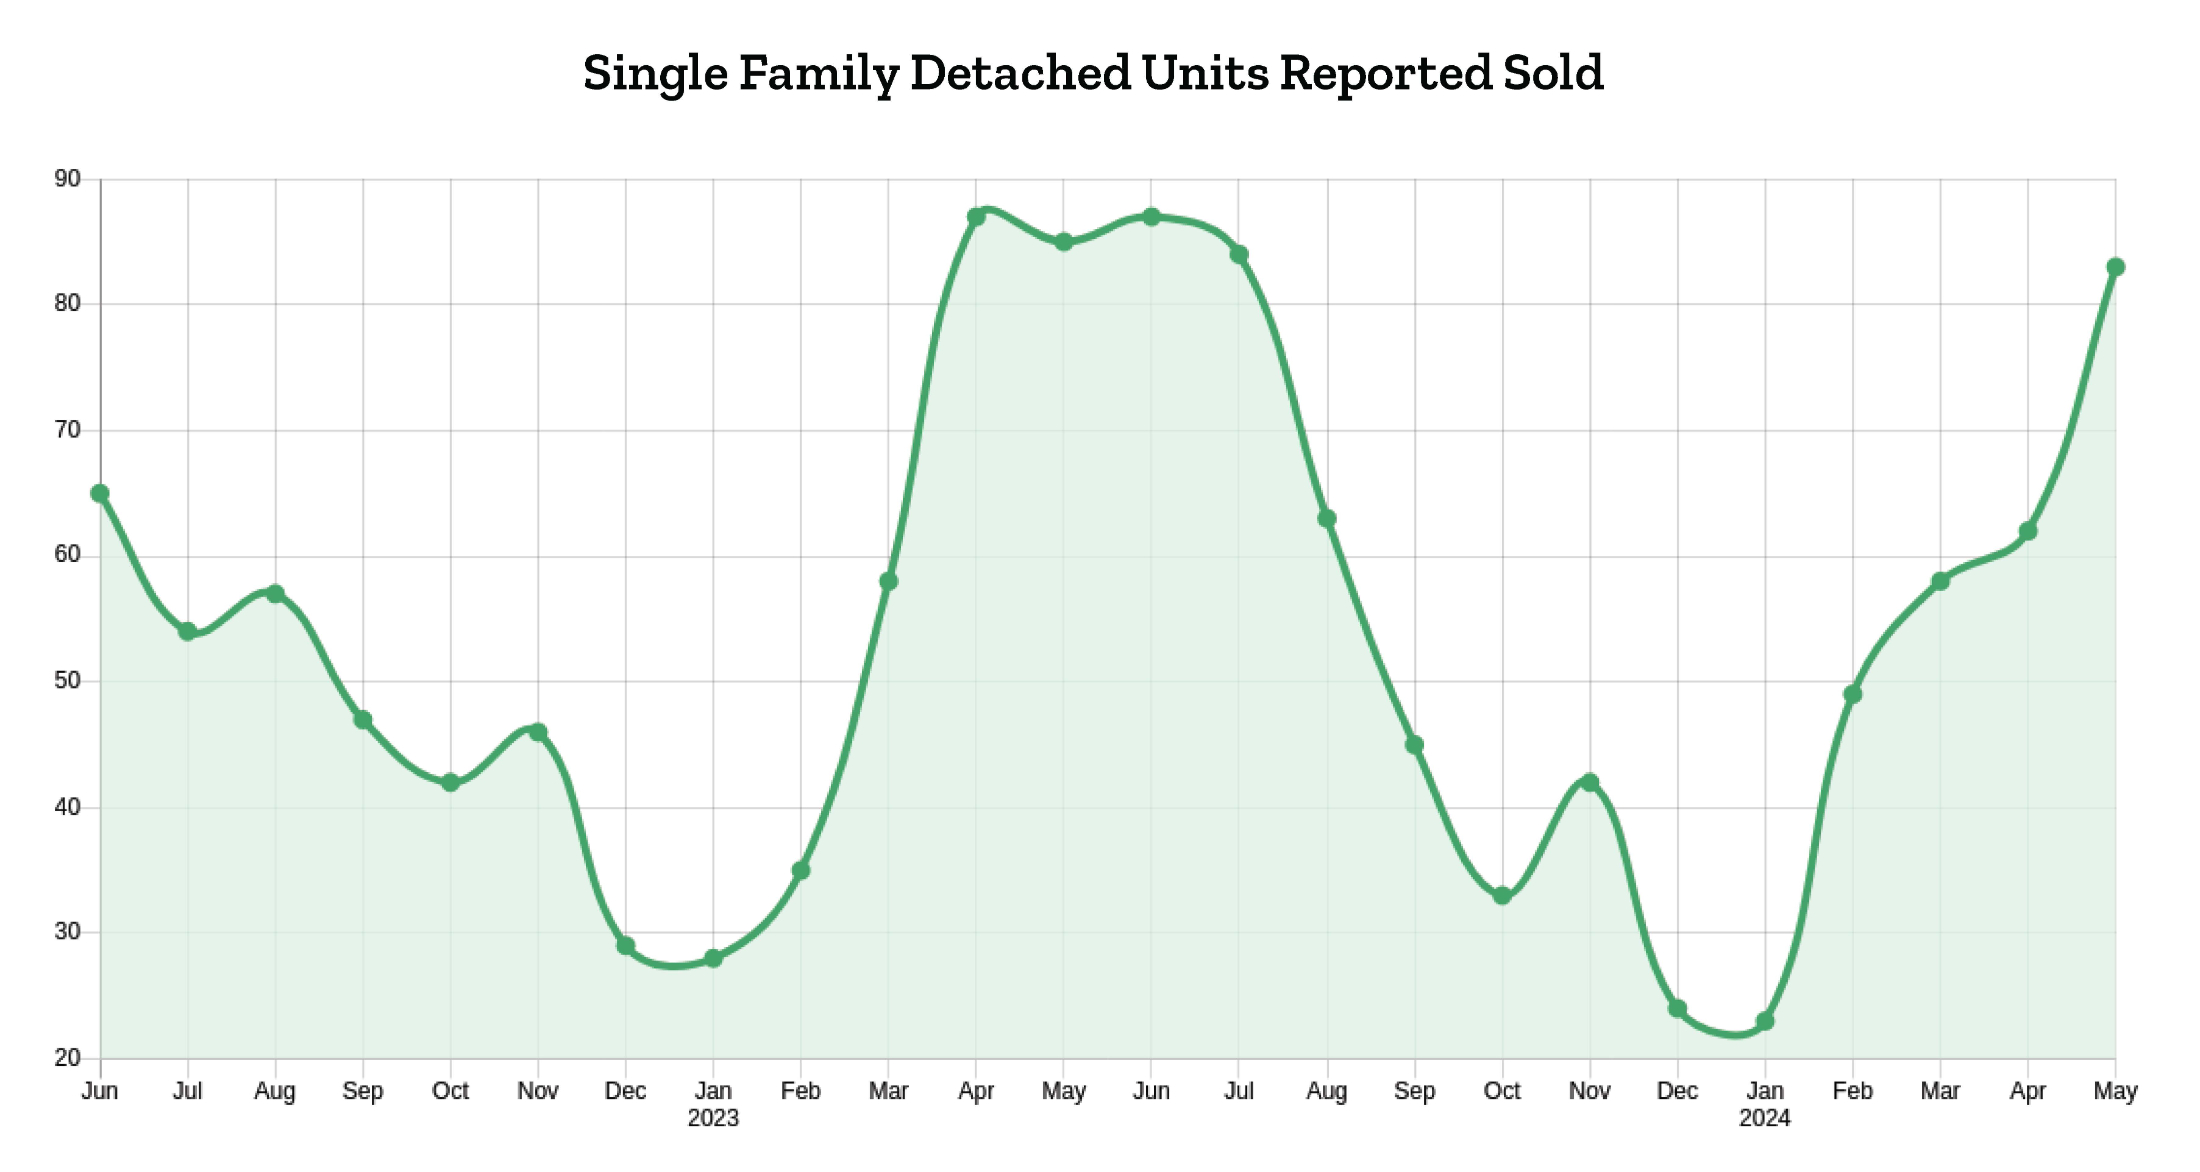
Sell-to-List Ratio: The market's sell-to-list ratio for June was 64.75% (79 houses sold/122 houses listed), up from May, 2025.
Sale Price to List Price Ratio: Homes are selling at an average of 98.17% of their list price, which is down 0.5% from last month.
Days on Market: Properties are taking longer to sell with the increased inventory, with the average time on market for homes in June coming in at 44 days.

Please contact our team with any real estate-related questions; we’re here to provide you with the guidance and advice needed for this type of market.
JULY 2, 2025
HOUSING MARKET WEATHERING UNCERTAINTY AS SUMMER UNFOLDS
NANAIMO, BC – The Vancouver Island Real Estate Board (VIREB) recorded 858 unit sales (all property types) in June 2025, up 18 per cent from one year ago. Year-over-year active listings (all property types) were 4,542, up one per cent from the previous year.
In the single-family category (excluding acreage and waterfront), 474 homes sold in June, up 34 per cent from one year ago and an increase of 16 per cent from May. Sales of condo apartments last month came in at 77, a decrease of six per cent year over year and up four per cent from May. In the row/townhouse category, 93 units changed hands in June, up two per cent from one year ago and an increase of eight per cent from May.
Active listings of single-family homes were 1,527 last month compared to 1,566 in June 2024. VIREB’s inventory of condo apartments was 394 in June, down from the 440 listings posted one year ago. There were 365 row/townhouses for sale last month compared to 364 in June 2024.
VIREB Chair Olivier Naud notes that VIREB’s housing market remains balanced, with approximately six months of inventory, an optimal situation for buyers and sellers.
“The continued economic uncertainty caused by the Trump administration’s tariff threats makes it difficult to forecast any long-term trends in the housing market,” says Naud. “However, despite some oddities and anomalies in local markets that are seeing some collaped sales, the Vancouver Island housing market is proving to be remarkably resilient. It continues to buck the trend of declining home sales experienced on the Lower Mainland.”
Moving on to prices, the board-wide benchmark price (MLS® Home Price Index) of a single-family home was $803,400 in June 2025, up two per cent from one year ago. In the apartment category, the benchmark price was $406,600 last month, down one per cent from the previous June. The benchmark price of a townhouse in June was $554,800, up two per cent from the prior year.
In Campbell River, the benchmark price of a single-family home was $703,000 last month, down slightly from June 2024. The Comox Valley’s year-over-year benchmark price rose by four per cent to $874,700. In the Cowichan Valley, the benchmark price was $801,800, up one per cent from June 2024. Nanaimo’s year-over-year benchmark price rose by two per cent to $837,900, while the Parksville-Qualicum area saw its benchmark price increase by one per cent to $906,200. The cost of a benchmark single-family home in Port Alberni was $530,900, up three per cent from the previous year. For the North Island, the benchmark price of a single-family home rose by nine per cent to $477,900.
ABOUT VIREB
VIREB represents over 1,100 REALTORS® in nearly 90 member offices on Vancouver Island, from the Malahat in the south to the northern tip.
VIREB cautions that average price information can be useful in establishing trends over time but does not indicate the actual prices in centres comprised of widely divergent neighbourhoods or account for price differential between geographic areas.
Trademarks are owned or controlled by The Canadian Real Estate Association (CREA) and identify real estate professionals who are members of CREA (REALTOR®) and/or the quality of services they provide (MLS®).
Visit our website for updated information at www.vireb.com.
HPI Note: Areas with insufficient data do not generate statistics and are not included in the HPI graphs.